Difference between revisions of "The Barbican"
Jump to navigation
Jump to search
| Line 7: | Line 7: | ||
<pre class="wikidiagrams"> | <pre class="wikidiagrams"> | ||
barbican_meter_locations.json Heat Meter and Sensor Locations | |||
barbican_discussion.json Monitoring Architecture | barbican_discussion.json Monitoring Architecture | ||
all_lorawan.json All LoRaWAN Architecture | all_lorawan.json All LoRaWAN Architecture | ||
meter_installation.json Principles of calculating flow rates from temperatures | meter_installation.json Principles of calculating flow rates from temperatures | ||
heatweb_barbican_graph1.json Graph 1 | heatweb_barbican_graph1.json Graph 1 | ||
heatweb_barbican_micronics_1.json Micronics Installation 1 | heatweb_barbican_micronics_1.json Micronics Installation 1 | ||
Revision as of 17:01, 13 September 2022
Designs
barbican_meter_locations.json Heat Meter and Sensor Locations
barbican_discussion.json Monitoring Architecture
all_lorawan.json All LoRaWAN Architecture
meter_installation.json Principles of calculating flow rates from temperatures
heatweb_barbican_graph1.json Graph 1
heatweb_barbican_micronics_1.json Micronics Installation 1
Drawings
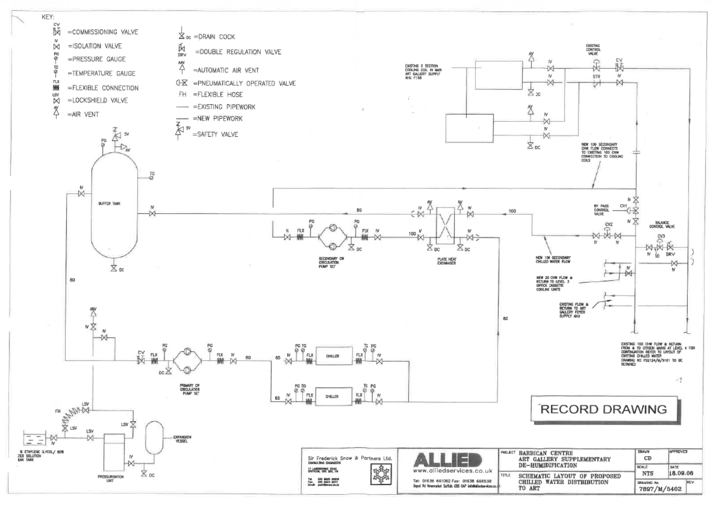
![]() CHW_Art_Gallery_-_Temporary_Heat_Meter_Locations
CHW_Art_Gallery_-_Temporary_Heat_Meter_Locations
Heat Meters
See Micronics Heat Meters for information on how to connect Micronics Heat Meters.
- Error creating thumbnail: Unable to save thumbnail to destination
The first Micronics heat meter provided data immediately as expected, matching values on the screen. This can be viewed in the Node-RED software in the debug window, where one can inspect the data telegrams being sent and received. [1, 3 ...] represents device 1, function code 3 (read register). The response should also start with [1, 3 ...]
- Error creating thumbnail: Unable to save thumbnail to destination
However, the second meter provided incorrectly formed responses and will require further investigation. It is the same setup entirely, so the only difference could be the polarity is reversed on the RS485 line.
