Difference between revisions of "HIU Monitoring and Controls Refurbishment"
| Line 4: | Line 4: | ||
This dashboard can be applied to any make of HIU where it is possible to extract data, either through wired connection or through the use of additional sensors. | This dashboard can be applied to any make of HIU where it is possible to extract data, either through wired connection or through the use of additional sensors. | ||
This form of dashboard uses colours and text to give an 'at-a-glance' feeling for all temperatures and current operation. | |||
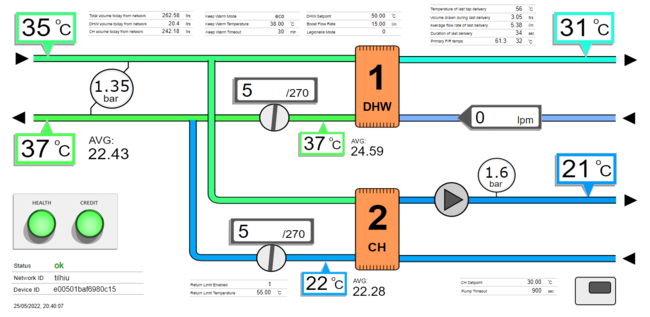
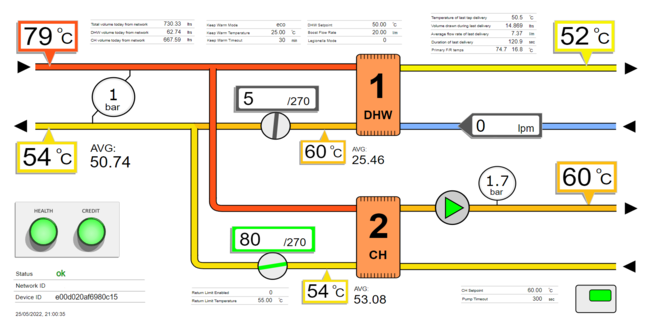
The two screenshots below show two systems in properties side by side. The one on the left is using compensated heating functions, and the one on the right is running a set central heating temperature. These HIUs are part of a field trial to understand the limits of return temperature performance that can be achieved with some more advanced HIU functionality. The key difference can be seen in the VWART (average return) figures on central heating of 22.26C and 53.08C respectively. Both systems are fitted with the same radiator systems, unbalanced with a 10C drop. | |||
[[File:Hiulowvwart.png|frameless|650x650px]] [[File:Hiuhiwvwart.png|frameless|650x650px]] | |||
These systems can be seen running side by side live on the [[Dual HIU dashboard example]]. | |||
The benefits of being able to test different settings and functions out on live systems in the field is of obvious advantage. With numerous systems in a development, it become much easier to optimise functionality than in a laboratory or R&D environment. The random element introduced by the real world shows up problems, and it is possible to run adjacent systems with different settings to compare outcomes. | |||
In our many adventures in the field, where we come face to face with occupants, we have found that in every case (bar one) the occupants welcome some visibility on systems and are keen to see if improvements can be made. Occupants who suffer problems are all to aware that part of the problem can lie in engineers never been present to witness a problem, so having monitoring gives them evidence - even if they do not have access to data they are aware that you now do, and should be able to figure it out. Which you now can. | |||
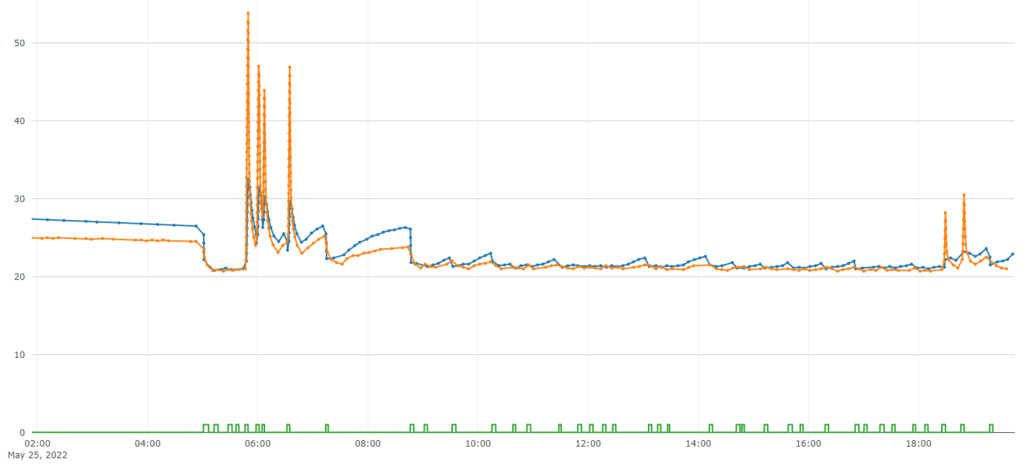
The graph below shows central heating flow are return temperatures as well as room thermostat calls. | The graph below shows central heating flow are return temperatures as well as room thermostat calls. | ||
Revision as of 20:25, 25 May 2022
Above is a live dashboard shows a twin plate HIU fitted with open-source monitoring (watch it and figures will change in real-time). If asked to login, use guest / guest.
This dashboard can be applied to any make of HIU where it is possible to extract data, either through wired connection or through the use of additional sensors.
This form of dashboard uses colours and text to give an 'at-a-glance' feeling for all temperatures and current operation.
The two screenshots below show two systems in properties side by side. The one on the left is using compensated heating functions, and the one on the right is running a set central heating temperature. These HIUs are part of a field trial to understand the limits of return temperature performance that can be achieved with some more advanced HIU functionality. The key difference can be seen in the VWART (average return) figures on central heating of 22.26C and 53.08C respectively. Both systems are fitted with the same radiator systems, unbalanced with a 10C drop.
These systems can be seen running side by side live on the Dual HIU dashboard example.
The benefits of being able to test different settings and functions out on live systems in the field is of obvious advantage. With numerous systems in a development, it become much easier to optimise functionality than in a laboratory or R&D environment. The random element introduced by the real world shows up problems, and it is possible to run adjacent systems with different settings to compare outcomes.
In our many adventures in the field, where we come face to face with occupants, we have found that in every case (bar one) the occupants welcome some visibility on systems and are keen to see if improvements can be made. Occupants who suffer problems are all to aware that part of the problem can lie in engineers never been present to witness a problem, so having monitoring gives them evidence - even if they do not have access to data they are aware that you now do, and should be able to figure it out. Which you now can.
The graph below shows central heating flow are return temperatures as well as room thermostat calls.


