Difference between revisions of "Grafana"
| Line 27: | Line 27: | ||
There are many similarities between cloud native services and HVAC services, and it makes complete sense to adopt systems developed in the cloud industry if they can benefit the HVAC industry, and assist in saving carbon. When the disk space on a server is running low, services may become slow, and when a pump in a heat network has faulty bearings, hot water may cool down. Apart from the names involved, the systems used to catch and highlight problems are identical. | There are many similarities between cloud native services and HVAC services, and it makes complete sense to adopt systems developed in the cloud industry if they can benefit the HVAC industry, and assist in saving carbon. When the disk space on a server is running low, services may become slow, and when a pump in a heat network has faulty bearings, hot water may cool down. Apart from the names involved, the systems used to catch and highlight problems are identical. | ||
The key difference between cloud systems and HVAC is open source. Cloud systems run on open-source software, and are developed collaboratively. HVAC runs on closed systems, where every function rests on installers creating them. It is no surprise that the standard methods used in the cloud landscape are light years ahead of anything in HVAC. | The key difference between cloud systems and HVAC is open source. Cloud systems run on open-source software, and are developed collaboratively. HVAC runs on closed systems, where every function rests on installers creating them. It is no surprise that the standard methods used in the cloud landscape are light years ahead of anything in HVAC. They are also far more evolved, covering everything down to engineer notification, and alarm escalation. | ||
*Freemium model, with a free forever plan alongside commercial packages | *Freemium model, with a free forever plan alongside commercial packages | ||
Revision as of 14:42, 20 November 2022
Links
- https://grafana.com/
- https://grafana.com/go/grafanaconline/2022/design-spark-air-quality-monitoring-use-case/
- https://grafana.com/blog/2021/06/15/resources-for-easy-diy-iot-projects-with-grafana-arduino-prometheus-and-loki/
- https://grafana.com/blog/2022/06/24/monitoring-a-hard-water-softener-at-home-with-grafana-cloud/
Reasons for Using Grafana
Grafana has been developed to monitor and alarm cloud native systems, such as servers and online services. It is open-source as well as a managed service, providing all the functions required for maintaining critical services.
The cloud landscape requires continued up-times, monitoring of containers and clusters, and advanced alarm routing with escalation of problems as they occur to prevent any loss of services.
There are many similarities between cloud native services and HVAC services, and it makes complete sense to adopt systems developed in the cloud industry if they can benefit the HVAC industry, and assist in saving carbon. When the disk space on a server is running low, services may become slow, and when a pump in a heat network has faulty bearings, hot water may cool down. Apart from the names involved, the systems used to catch and highlight problems are identical.
The key difference between cloud systems and HVAC is open source. Cloud systems run on open-source software, and are developed collaboratively. HVAC runs on closed systems, where every function rests on installers creating them. It is no surprise that the standard methods used in the cloud landscape are light years ahead of anything in HVAC. They are also far more evolved, covering everything down to engineer notification, and alarm escalation.
- Freemium model, with a free forever plan alongside commercial packages
- Quick to setup
- Community Edition that runs in Docker on a controller, as well as online, and as a hosted service
- Scalable
- Secure
- Public and private dashboards
- Technical support
- Removes need for further cloud infrastructure, by providing core functions of data storage, visualisation and alarming
- Works with both time series and static data
- Numerous plugins, including SVG graphics manipulation
- Compatible with all data sources
- Powerful query construction
- Repeating objects and panels allow for dynamic dashboarding
- Organisation and user management
Points to Consider
- HVAC equipment (and IoT in general) often differs from server architecture (Grafana origins) in regards to data bandwidths, with some devices connected on SIM cards or radios with very little data use available.
- Needs to remain compatible with the standard 5 level MQTT structure (Network_Id / Node_Id / Device_Id / Group / Key) so that dashboards based on named devices can be shared easily. The Network_Id will be the only variable that changes. http://heatweb.co.uk/w/index.php?title=Heat_Network_Protocol
- With limited data bandwidth, installations can make use of a data concentrator, a controller that generates summary statistics and alarms from groups of devices on a local network, that can then be sent over the limited uplink bandwidth.
- It is required to make use of a data request function (a sync), whereby all (or specific) data on a device can be requested for publishing. This allows for high resolution historic data held on a controller that would not normally be published, to be remotely requested, published, and then accessed in the even of problems. Such a function would also apply to detailed system data and files.
- Two-way communication is required, with a need to implement user commands. Examples include remote control over central heating, or the facility to switch equipment between on / off / auto states. Security needs to be considered with control dashboards locked to unauthorised users. Logging of control requests (commands) is required. In the existing protocol, the data groups cmd and set are used for commands and persistent settings respectively.
Data Routing
InfluxDB and MySQL
Numeric data is fed into InfluxDB, and all data is fed into MySQL.
Prometheus via InfluxDB Endpoint
- All data to be fed in through an InfluxDB connector to Prometheus. https://grafana.com/docs/grafana-cloud/data-configuration/metrics/metrics-influxdb/push-from-telegraf/?pg=blog&plcmt=body-txt
- Numeric data, in groups /dat/ and /stat/, are fed in as metrics, with labels for network, node, device, vargroup, and varkey.
- All other data, generally text based, is fed in as a group measurement with a label for every key. e.g. /settings/title and /settings/email would go into a settings measurement, with labels for title and email.
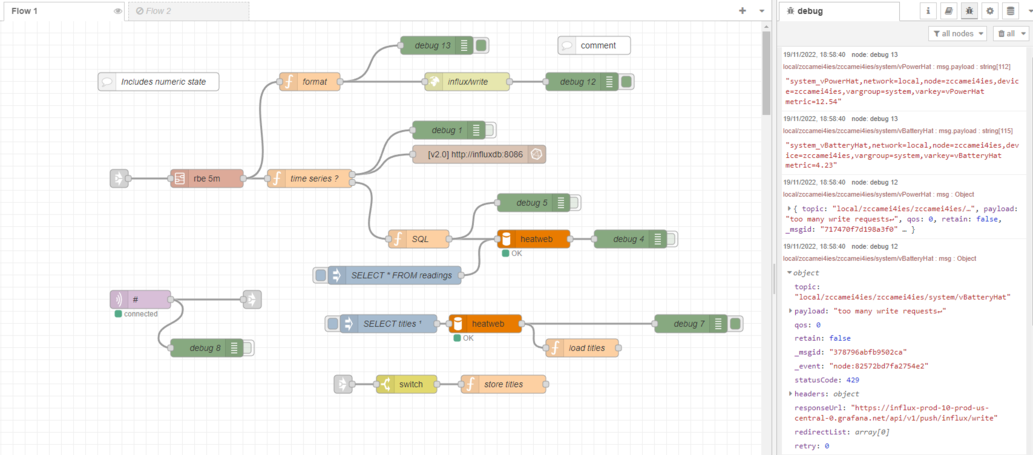
The following Node-RED Flow is successfully feeding data into Prometheus on Grafana Cloud via the InfluxDB end-point.
The following function is used to convert MQTT formatted messages into the InfluxDB format required.
if (isNaN(msg.payload)) { return null; }

var tops = msg.topic.split("/");

//const body = 'test,bar_label=abc,source=grafana_cloud_docs metric=35.2';

var body = tops[3] + '_' + tops[4] + ",network=" + tops[0] + ",node=" + tops[1] + ",device=" + tops[2] + ",vargroup=" + tops[3] + ",varkey=" + tops[4] + " metric=" + msg.payload ;

msg.payload = body;

return msg;
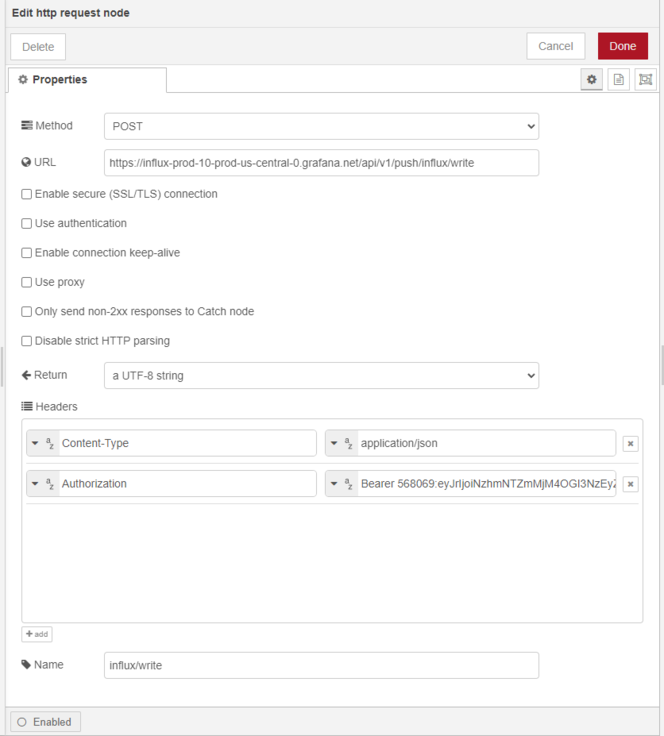
This formatted message is then fed into an http request node containing credentials.
Prometheus Queries in Grafana
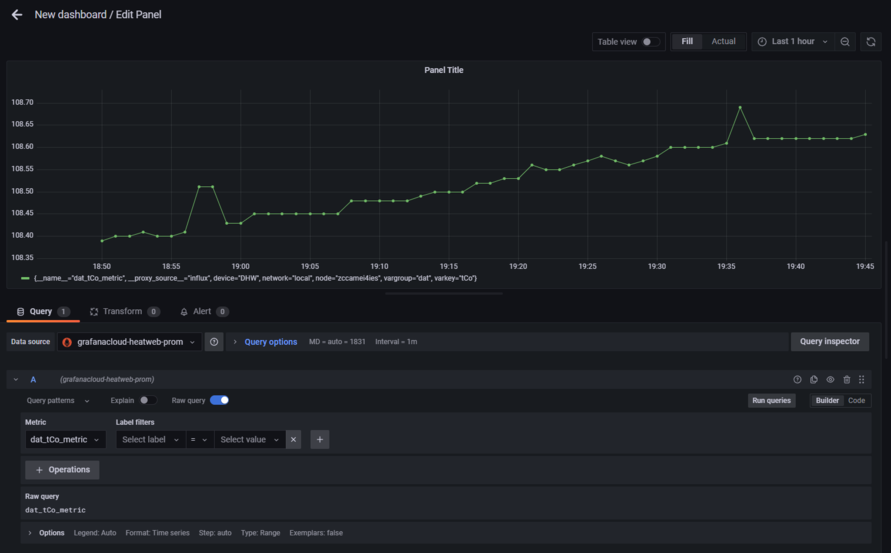
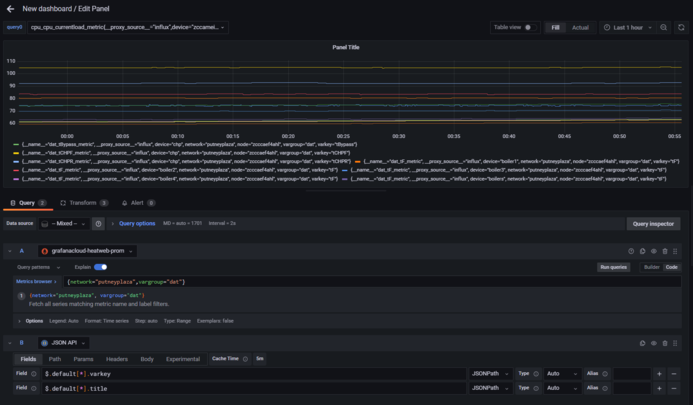
Numeric Data
Numeric data can be viewed in Grafana, pulling data from Prometheus.
Metadata from GitHub
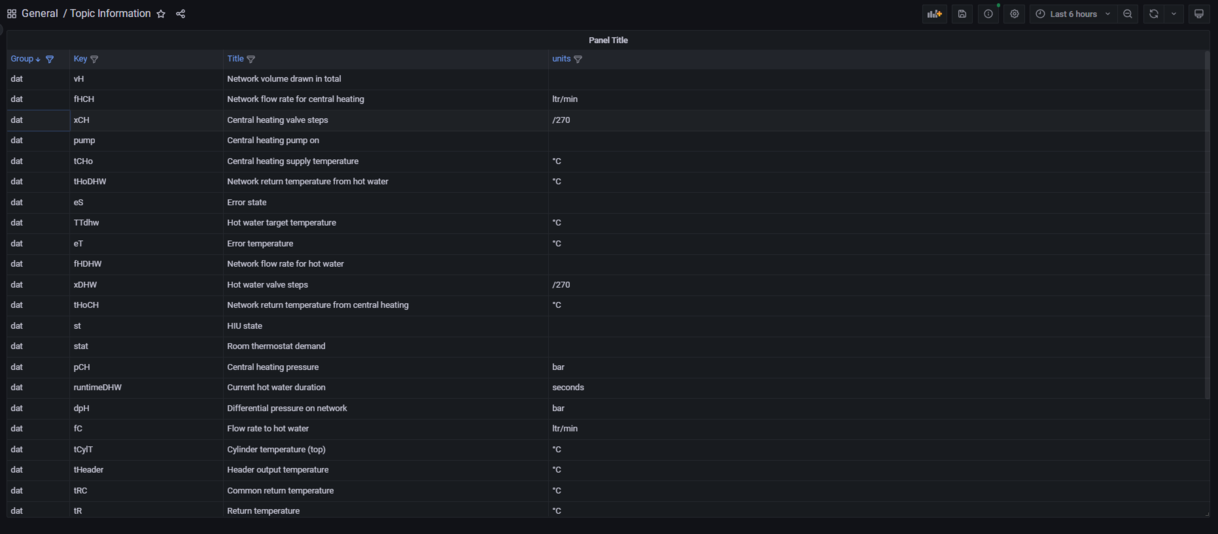
Standard topic metadata can be pulled from GitHub as JSON.
https://raw.githubusercontent.com/heatweb/plumbing-controller/main/json/topics/default.json
This is a variant on https://github.com/heatweb/heat-network/blob/master/devices/default_topics.json tailored for Grafana.
Current Problems:
- How to perform lookups on text values, so that repeating panels can automatically be given meaningful titles. e.g. /b1/settings/title and /b1/system/ipLAN can be combined with labels into a title "Boiler 1 (b1) 192.168.1.113"
- How to filter on a lookup, for example to display in a row all devices with a /system/deviceType = "boiler" and also to then repeat for each network in a list. This is currently working using a variable lookup from MySQL.
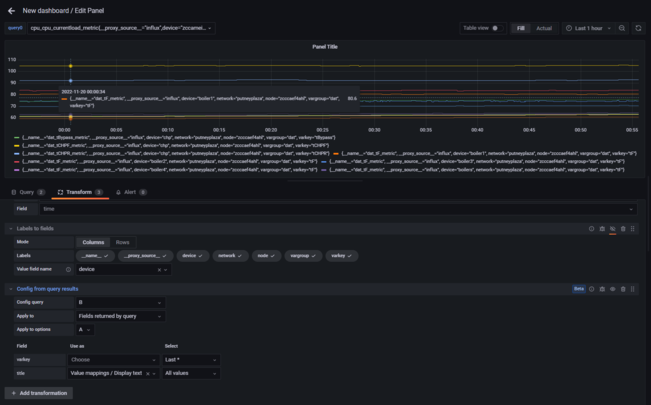
Below is a FAILED attempt to combine data sources to add metadata to graphs, specifically to get each line labelled as "device, title" e.g. "boiler1, Flow Temperature", and to pull in units.
Kiosk
Using a Forms plugin and the Virtual Keyboard extension in Chrome, Grafana can provide a complete UI for altering system settings using the standard 7" touchscreen display.
Installation
sudo docker run -d -p 3000:3000 --name=grafana --restart=always --net mqtt -v grafana-storage:/var/lib/grafana grafana/grafana-oss
See https://github.com/heatweb/plumbing-controller/blob/main/scripts/docker-setup.sh
Setting up for reverse proxy
Open a console into container.
Shell into Grafana and edit ini. May need to install nano
apk update
apk add nano
nano /usr/share/grafana/conf/defaults.ini
Scroll down and alter to...
# The public facing domain name used to access grafana from a browser
domain = hwwiki.ddns.net

# Redirect to correct domain if host header does not match domain
# Prevents DNS rebinding attacks
enforce_domain = false

# The full public facing url
#root_url = %(protocol)s://%(domain)s:%(http_port)s/
root_url = %(protocol)s://%(domain)s:/dashboard/

# Serve Grafana from subpath specified in `root_url` setting. By default it is set to `false` for compatibility reasons.
serve_from_sub_path = true
At the bottom you can also set an anonymous login to allow access without a password.
Restart container
