The Barbican
Designs
barbican_discussion.json Monitoring Architecture
barbican_meter_locations.json Heat Meter and Sensor Locations
meter_installation.json Principles of calculating flow rates from temperatures
barbican_wiring_1.json Wiring
heatweb_barbican_graph1.json Graph 1
Drawings
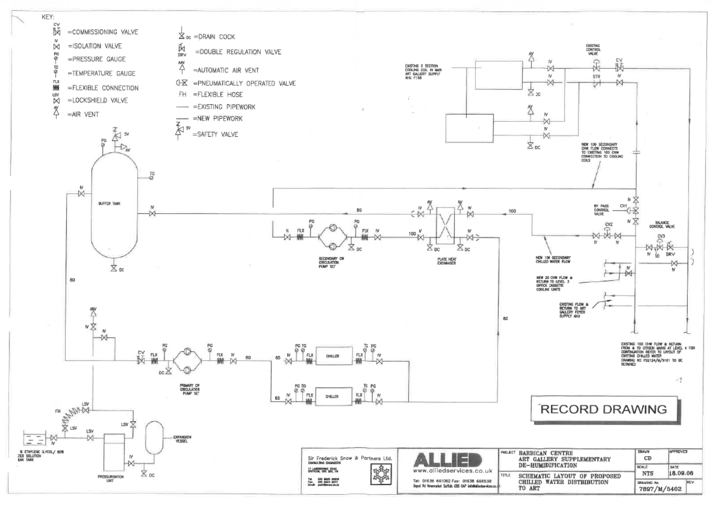
![]() CHW_Art_Gallery_-_Temporary_Heat_Meter_Locations
CHW_Art_Gallery_-_Temporary_Heat_Meter_Locations
Temperature Data
Heat Meters
See Micronics Heat Meters for information on how to connect Micronics Heat Meters.
- Error creating thumbnail: Unable to save thumbnail to destination
The first Micronics heat meter provided data immediately as expected, matching values on the screen. This can be viewed in the Node-RED software in the debug window, where one can inspect the data telegrams being sent and received. [1, 3 ...] represents device 1, function code 3 (read register). The response should also start with [1, 3 ...]
- Error creating thumbnail: Unable to save thumbnail to destination
However, the second meter provided incorrectly formed responses and will require further investigation. FIXED: The GND for the RS485 was into the wrong terminal. When corrected, the data matched heat meter display.
Data Storage Locally and to Dropbox
Data subscribed to is stored on the server locally into csv files.
A file browser utility is included on this wiki with a user account setup to provide simple access to stored CSV files.
Every day these files are sent to Dropbox, and then can optionally be purged from the server.
We are currently storing all /dat/ incoming MQTT data, fed from field trials. This will ensure we retain long-term records of all operational data, from all field trials, down to 1 second resolution. It will be a lot of data, but Dropbox has more than enough room.
Time Series Data Visualisation Using InfluxDB and Grafana
Client Dashboard
Grafana includes organisation, role and user management, making it straightforward to setup a dedicated client portal with dashboards customised to best show the data and allow analysis. A light theme has been used.
Sections in Heating and Cooling can be expanded.


